
It’s no secret that Richmonders love their pets, from beloved house cats and doggies, like Bagel the Beagle (RIP), to the slithering reptilian ones that sometimes bite. And we now have the data to prove it.
Driving the news: Just over half of all Richmond-area households have a pet — and households with dogs outnumber those with cats 2-to-1, according to data from the U.S. Census Bureau’s American Housing Survey.
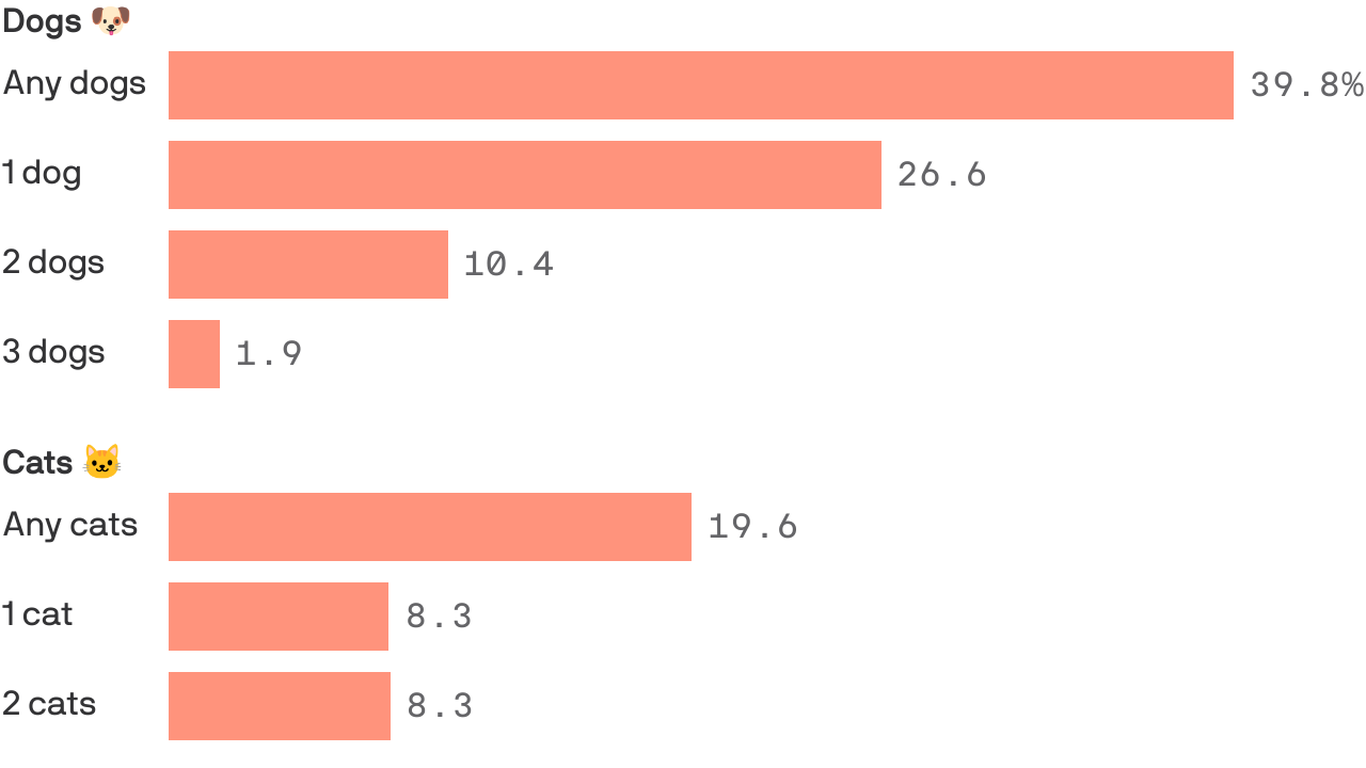
And in the Richmond area, dogs rule when it comes to what type of furry friend locals adopt.
- 🐩 Nearly 40% of households have at least one dog.
- 🐈 And nearly 20% of homes have at least one cat.
By the numbers: An estimated 273,500 households have at least one pet in the Richmond-metro area, representing 50.5% of the region’s more than 541,000 households, per census data.
- Dogs are in 215,000 households.
- Cats are in 105,700 households.
Yes, but: Of households with cats, just over half are home to two or more cats — and the data doesn’t tell us how many households, like Karri’s, have both a dog and a cat.
The intrigue: Pets aren’t limited to cats and dogs, of course, and Richmonders have plenty of other creatures in their families, which in order of local popularity as reported to the census folks include:
- 🐠 Fish in 16,300 households.
- 🦎 Reptiles in 13,400 households.
- 🦜 Birds in 10,000 households.
- 🦔 Small mammals in 8,000 households.
The bottom line: Richmond finally has a data-driven reason to claim Dogtown — the moniker once reserved just for Manchester.